
https://ift.tt/oK1Osnm
From the Census Bureau reported that overall construction spending increased 1.3%:
Construction spending during January 2022 was estimated at a seasonally adjusted annual rate of $1,677.2 billion, 1.3 percent above the revised December estimate of $1,655.8 billion. The January figure is 8.2 percent above the January 2021 estimate of $1,549.8 billion.
emphasis added
Private and public spending increased:
Spending on private construction was at a seasonally adjusted annual rate of $1,326.5 billion, 1.5 percent above the revised December estimate of $1,307.1 billion …
In January, the estimated seasonally adjusted annual rate of public construction spending was $350.7 billion, 0.6 percent above the revised December estimate of $348.7 billion.
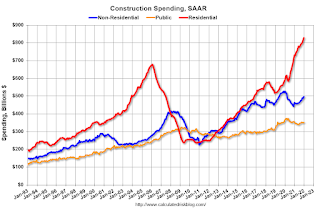
This graph shows private residential and nonresidential construction spending, and public spending, since 1993. Note: nominal dollars, not inflation adjusted.
Residential (red) spending is 22% above the bubble peak (in nominal terms – not adjusted for inflation).
Non-residential (blue) spending is 20% above the bubble era peak in January 2008 (nominal dollars).
Public construction spending is 8% above the peak in March 2009.
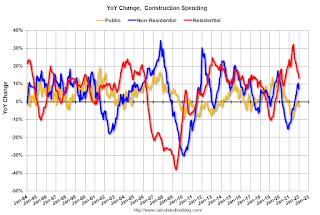
On a year-over-year basis, private residential construction spending is up 13.4%. Non-residential spending is up 7.3% year-over-year. Public spending is down 1.3% year-over-year.
Financial Services
