
Hotels: Occupancy Rate Up 8% Compared to Same Week in 2019
https://ift.tt/3ssf6Dd
Note: Since occupancy declined sharply at the onset of the pandemic, CoStar is comparing to 2019.
U.S. hotel performance surpassed the levels seen during the comparable week of 2019, according to STR‘s latest data through December 18.
December 12-18, 2021 (percentage change from comparable week in 2019*):
• Occupancy: 53.8% (+7.7%)
• Average daily rate (ADR): US$121.87 (+11.6%)
• Revenue per available room (RevPAR): US$65.61 (+20.2%)Percentage changes were in part lifted by the comparable week of 2019 (ending 21 December) being closer to Christmas.
*Due to the steep, pandemic-driven performance declines of 2020, STR is measuring recovery against comparable time periods from 2019.
emphasis added
The following graph shows the seasonal pattern for the hotel occupancy rate using the four week average.
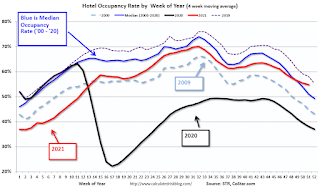
The red line is for 2021, black is 2020, blue is the median, dashed purple is 2019, and dashed light blue is for 2009 (the worst year on record for hotels prior to 2020).
Financial Services
via Calculated Risk https://ift.tt/IiXOKI
December 23, 2021 at 02:18PM
