https://ift.tt/dnECUhk
The first graph shows the unemployment rate by four levels of education (all groups are 25 years and older) through March 2021. Note: This is an update to a post from a few years ago.
Unfortunately, this data only goes back to 1992 and includes only three recessions (the stock / tech bust in 2001, and the housing bust/financial crisis, and the 2020 pandemic). Clearly education matters with regards to the unemployment rate, with the lowest rate for college graduates at 2.3% in January, and highest for those without a high school degree at 6.3% in January.
All four groups were generally trending down prior to the pandemic. And all are nearly back to pre-pandemic levels now.

Note: This says nothing about the quality of jobs – as an example, a college graduate working at minimum wage would be considered "employed".
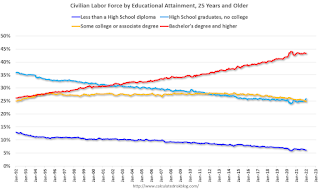
This brings up an interesting question: What is the composition of the labor force by educational attainment, and how has that been changing over time?
Here is some data on the U.S. labor force by educational attainment since 1992.

This is the only category trending up. "Some college" has been steady (and trending down lately), and both "high school" and "less than high school" have been trending down.
Based on current trends, probably half the labor force will have at least a bachelor’s degree by the end of this decade (2020s).
Some thoughts: Since workers with bachelor’s degrees typically have a lower unemployment rate, rising educational attainment is probably a factor in pushing down the overall unemployment rate over time.
Also, I’d guess more education would mean less labor turnover, and that education is a factor in lower weekly claims (prior to the pandemic).
A more educated labor force is a positive for the future.
Financial Services

